Software as a Service (SaaS)
UK

The table below provides summary statistics for permanent job vacancies requiring SaaS skills. It includes a benchmarking guide to the annual salaries offered in vacancies that cited SaaS over the 6 months leading up to 30 May 2025, comparing them to the same period in the previous two years.

6 months to
30 May 2025
Same period 2024 Same period 2023
Rank 111 76 65
Rank change year-on-year -35 -11 -14
Permanent jobs citing SaaS 1,542 3,422 4,675
As % of all permanent jobs advertised in the UK 2.78% 3.31% 4.81%
As % of the Cloud Services category 10.09% 9.52% 11.12%
Number of salaries quoted 1,098 2,658 2,968
10th Percentile £32,500 £36,250 £41,250
25th Percentile £46,250 £46,250 £51,250
Median annual salary (50th Percentile) £65,000 £60,000 £67,500
Median % change year-on-year +8.33% -11.11% +3.85%
75th Percentile £83,750 £83,750 £87,500
90th Percentile £107,500 £100,000 £102,500
UK excluding London median annual salary £56,500 £55,000 £60,000
% change year-on-year +2.73% -8.33% -

All Cloud Skills
UK

SaaS falls under the Cloud Services category. For comparison with the information above, the following table provides summary statistics for all permanent job vacancies requiring cloud computing skills.

Permanent vacancies with a requirement for cloud computing skills 15,281 35,941 42,041
As % of all permanent jobs advertised in the UK 27.58% 34.80% 43.27%
Number of salaries quoted 10,069 26,912 27,490
10th Percentile £31,250 £30,000 £34,723
25th Percentile £42,500 £41,250 £46,250
Median annual salary (50th Percentile) £60,000 £57,500 £65,000
Median % change year-on-year +4.35% -11.54% +4.00%
75th Percentile £82,500 £76,250 £85,000
90th Percentile £103,750 £96,225 £102,500
UK excluding London median annual salary £53,500 £50,000 £55,000
% change year-on-year +7.00% -9.09% +4.76%

SaaS
Job Vacancy Trend

Job postings citing SaaS as a proportion of all IT jobs advertised.
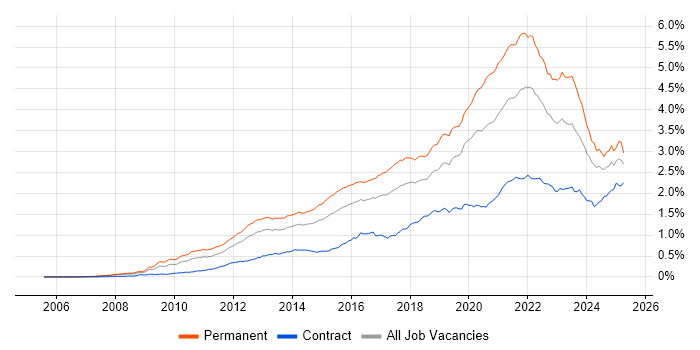
Job vacancy trend for SaaS in the UK

SaaS
Salary Trend

3-month moving average salary quoted in jobs citing SaaS.

Salary trend for SaaS in the UK

SaaS
Salary Histogram

Salary distribution for jobs citing SaaS over the 6 months to 30 May 2025.

Salary histogram for SaaS in the UK

SaaS
Top 17 Job Locations

The table below looks at the demand and provides a guide to the median salaries quoted in IT jobs citing SaaS within the UK over the 6 months to 30 May 2025. The 'Rank Change' column provides an indication of the change in demand within each location based on the same 6 month period last year.

Location Rank Change
on Same Period
Last Year
Matching
Permanent
IT Job Ads
Median Salary
Past 6 Months
Median Salary
% Change
on Same Period
Last Year
Live
Jobs
England -36 1,385 £65,000 +4.00% 16,666
UK excluding London -57 870 £56,500 +2.73% 16,751
Work from Home -35 729 £62,500 -3.85% 9,866
London -4 546 £80,000 - 2,023
South East -32 229 £55,000 -2.52% 4,652
North of England -99 208 £59,250 +7.73% 3,765
Midlands -27 184 £60,000 - 3,142
North West -129 103 £60,000 +8.11% 1,806
East of England +29 97 £82,500 +37.50% 2,465
Yorkshire -4 93 £58,500 +6.36% 1,528
West Midlands -49 93 £60,000 - 1,670
East Midlands +13 89 £60,000 +9.09% 1,263
South West -22 73 £55,000 - 1,919
Scotland +7 65 £52,500 -4.55% 685
North East +7 12 £65,000 +18.18% 436
Wales -9 10 £38,094 -30.74% 449
Northern Ireland +14 4 £40,000 -46.67% 242

SaaS
Co-occurring Skills and Capabilities by Category

The follow tables expand on the table above by listing co-occurrences grouped by category. The same employment type, locality and period is covered with up to 20 co-occurrences shown in each of the following categories:

Application Platforms
1 46 (2.98%) Microsoft Exchange
2 38 (2.46%) SharePoint
3 25 (1.62%) CMS
4 23 (1.49%) Confluence
4 23 (1.49%) IIS
5 10 (0.65%) Apache
5 10 (0.65%) nginx
6 9 (0.58%) Apache Spark
7 7 (0.45%) Apache Airflow
7 7 (0.45%) WordPress
8 3 (0.19%) Moodle
8 3 (0.19%) Oracle Workflow
9 2 (0.13%) BizTalk Server
10 1 (0.065%) Headless CMS
10 1 (0.065%) JBoss
10 1 (0.065%) Tomcat
10 1 (0.065%) Totara
10 1 (0.065%) Umbraco
Applications
1 38 (2.46%) Microsoft Excel
2 24 (1.56%) Microsoft Office
3 22 (1.43%) Microsoft PowerPoint
4 12 (0.78%) Spreadsheet
5 8 (0.52%) Adobe XD
6 7 (0.45%) MS Visio
6 7 (0.45%) Photoshop
7 6 (0.39%) Sketch
8 4 (0.26%) Adobe Creative Suite
9 3 (0.19%) Adobe Illustrator
9 3 (0.19%) InDesign
9 3 (0.19%) Productboard
10 2 (0.13%) Chatbot
10 2 (0.13%) Microsoft Project
10 2 (0.13%) Trello
11 1 (0.065%) Adobe Premiere
11 1 (0.065%) AutoCAD
11 1 (0.065%) Notion
11 1 (0.065%) S-PLUS
Business Applications
1 29 (1.88%) NetSuite
2 22 (1.43%) Shopify
3 17 (1.10%) Magento
4 15 (0.97%) Dynamics CRM
5 3 (0.19%) Dynamics NAV
5 3 (0.19%) Oracle ERP
5 3 (0.19%) Salesforce CRM
6 2 (0.13%) Dynamics AX
6 2 (0.13%) Oracle EBS
6 2 (0.13%) Oracle Payables
6 2 (0.13%) Oracle Procure-to-Pay
6 2 (0.13%) SAP Hybris
7 1 (0.065%) Oracle BPM
7 1 (0.065%) Oracle EBS R12
7 1 (0.065%) Oracle General Ledger
7 1 (0.065%) Oracle Receivables
7 1 (0.065%) Remedy ITSM
7 1 (0.065%) Temenos T24
7 1 (0.065%) TrackWise
7 1 (0.065%) Unit4 Business World
Cloud Services
1 465 (30.16%) Azure
2 376 (24.38%) AWS
3 199 (12.91%) PaaS
4 140 (9.08%) IaaS
5 133 (8.63%) Microsoft 365
6 91 (5.90%) GCP
7 87 (5.64%) Azure DevOps
8 76 (4.93%) Power Platform
9 73 (4.73%) Entra ID
10 71 (4.60%) Serverless
11 65 (4.22%) GitHub
12 39 (2.53%) Dynamics 365
13 34 (2.20%) AWS Lambda
14 29 (1.88%) Azure AI
14 29 (1.88%) Azure Key Vault
15 28 (1.82%) Azure Monitor
16 27 (1.75%) Boomi
16 27 (1.75%) Cloud Computing
17 26 (1.69%) Power Automate
18 24 (1.56%) GitHub Actions
Communications & Networking
1 59 (3.83%) Firewall
2 54 (3.50%) DNS
3 48 (3.11%) VPN
4 25 (1.62%) WAN
5 22 (1.43%) Internet
5 22 (1.43%) SD-WAN
6 20 (1.30%) TCP/IP
6 20 (1.30%) Wi-Fi
7 18 (1.17%) Network Security
8 15 (0.97%) DHCP
9 12 (0.78%) LAN
9 12 (0.78%) SSL
10 10 (0.65%) HTTP
11 9 (0.58%) SMTP
12 8 (0.52%) SAN
12 8 (0.52%) VLAN
13 7 (0.45%) Cisco IOS
14 6 (0.39%) HTTPS
14 6 (0.39%) IPsec
14 6 (0.39%) VoIP
Database & Business Intelligence
1 116 (7.52%) SQL Server
2 68 (4.41%) Power BI
3 55 (3.57%) MySQL
4 46 (2.98%) NoSQL
5 38 (2.46%) PostgreSQL
6 32 (2.08%) Big Data
7 29 (1.88%) Data Lake
8 21 (1.36%) Data Hub
8 21 (1.36%) SQL CLR
9 20 (1.30%) Relational Database
10 19 (1.23%) SQL Server Reporting Services
11 18 (1.17%) Data Warehouse
12 15 (0.97%) Elasticsearch
12 15 (0.97%) Metadata
13 13 (0.84%) SQL Server Analysis Services
14 12 (0.78%) Azure SQL Database
14 12 (0.78%) BigQuery
15 11 (0.71%) Amazon RDS
15 11 (0.71%) MongoDB
16 10 (0.65%) SQL Server Integration Services
Development Applications
1 80 (5.19%) Git
2 70 (4.54%) JIRA
3 50 (3.24%) Jenkins
4 16 (1.04%) Eclipse
4 16 (1.04%) IntelliJ
5 15 (0.97%) Jasmine
5 15 (0.97%) JUnit
5 15 (0.97%) Karma Test Runner
5 15 (0.97%) Mockito
5 15 (0.97%) Protractor
6 14 (0.91%) Selenium
7 12 (0.78%) Visual Studio
8 11 (0.71%) Oracle Forms
9 9 (0.58%) Postman
10 6 (0.39%) Cypress.io
10 6 (0.39%) SonarQube
11 5 (0.32%) GitLab
11 5 (0.32%) NUnit
11 5 (0.32%) Visual Studio Code
11 5 (0.32%) WiX
General
1 553 (35.86%) Social Skills
2 338 (21.92%) Finance
3 235 (15.24%) Analytical Skills
4 151 (9.79%) Marketing
5 101 (6.55%) Presentation Skills
6 99 (6.42%) Law
7 69 (4.47%) Organisational Skills
8 66 (4.28%) Legal
9 61 (3.96%) Public Sector
10 58 (3.76%) Retail
11 53 (3.44%) Banking
12 48 (3.11%) Inclusion and Diversity
13 34 (2.20%) Telecoms
14 29 (1.88%) Back Office
15 28 (1.82%) Games
16 26 (1.69%) Billing
17 25 (1.62%) Electronics
18 22 (1.43%) Manufacturing
19 20 (1.30%) Local Government
20 19 (1.23%) Advertising
Job Titles
1 251 (16.28%) Senior
2 199 (12.91%) Developer
3 167 (10.83%) Architect
4 146 (9.47%) Lead
5 105 (6.81%) Analyst
6 86 (5.58%) Solutions Architect
7 70 (4.54%) Senior Developer
8 65 (4.22%) Cloud Engineer
9 59 (3.83%) Consultant
9 59 (3.83%) Support Engineer
10 58 (3.76%) IT Support
10 58 (3.76%) Software Engineer
11 53 (3.44%) Product Manager
12 48 (3.11%) IT Engineer
12 48 (3.11%) IT Manager
13 47 (3.05%) Business Manager
14 44 (2.85%) SaaS Developer
15 43 (2.79%) Full-Stack Developer
16 41 (2.66%) Full-Stack Engineer
17 40 (2.59%) IT Support Engineer
Libraries, Frameworks & Software Standards
1 140 (9.08%) .NET
2 128 (8.30%) React
3 89 (5.77%) REST
4 67 (4.35%) HTML
5 63 (4.09%) CSS
6 62 (4.02%) AngularJS
7 57 (3.70%) Node.js
8 53 (3.44%) RESTful
9 37 (2.40%) .NET Core
10 34 (2.20%) Kafka
11 33 (2.14%) .NET Framework
12 31 (2.01%) Next.js
13 30 (1.95%) JSON
13 30 (1.95%) OAuth
14 25 (1.62%) Django
15 23 (1.49%) RabbitMQ
15 23 (1.49%) Web Services
15 23 (1.49%) XML
16 19 (1.23%) Entity Framework
16 19 (1.23%) Flask
Miscellaneous
1 95 (6.16%) Onboarding
2 90 (5.84%) Product Ownership
3 84 (5.45%) Self-Motivation
4 82 (5.32%) Cloud Native
5 63 (4.09%) Enterprise Software
6 56 (3.63%) Management Information System
7 45 (2.92%) Private Cloud
8 41 (2.66%) Data Centre
9 39 (2.53%) Analytical Mindset
10 36 (2.33%) Mobile App
10 36 (2.33%) Social Media
11 33 (2.14%) Public Cloud
12 32 (2.08%) Greenfield Project
12 32 (2.08%) Legacy Systems
13 31 (2.01%) Algorithms
14 29 (1.88%) Distributed Systems
15 24 (1.56%) Hybrid Cloud
16 23 (1.49%) Driving Licence
17 22 (1.43%) NHS
18 20 (1.30%) Virtual Team
Operating Systems
1 150 (9.73%) Windows
2 89 (5.77%) Linux
3 51 (3.31%) Windows Server
4 27 (1.75%) Android
5 20 (1.30%) Mac OS
6 13 (0.84%) Windows 10
7 12 (0.78%) Unix
8 9 (0.58%) Windows Server 2019
9 7 (0.45%) Windows Server 2016
10 5 (0.32%) VMS
10 5 (0.32%) Windows Server 2012
11 4 (0.26%) Windows Server 2008
12 2 (0.13%) Red Hat Enterprise Linux
12 2 (0.13%) Ubuntu
13 1 (0.065%) Apple iOS
13 1 (0.065%) CentOS
13 1 (0.065%) Debian
13 1 (0.065%) SUSE
Processes & Methodologies
1 413 (26.78%) Agile
2 381 (24.71%) Problem-Solving
3 259 (16.80%) DevOps
4 248 (16.08%) Roadmaps
5 193 (12.52%) CI/CD
6 179 (11.61%) Mentoring
7 176 (11.41%) B2B
8 174 (11.28%) Software Engineering
9 170 (11.02%) Analytics
10 156 (10.12%) CRM
10 156 (10.12%) Migration
11 152 (9.86%) Continuous Improvement
12 151 (9.79%) Project Management
13 139 (9.01%) Customer Service
14 134 (8.69%) ITIL
15 130 (8.43%) Artificial Intelligence
16 113 (7.33%) Decision-Making
16 113 (7.33%) Fintech
17 109 (7.07%) Coaching
18 106 (6.87%) Full-Stack Development
Programming Languages
1 272 (17.64%) SQL
2 201 (13.04%) Python
3 157 (10.18%) C#
4 150 (9.73%) JavaScript
5 116 (7.52%) TypeScript
6 108 (7.00%) PowerShell
7 80 (5.19%) Java
8 35 (2.27%) Bash
9 22 (1.43%) Bicep
9 22 (1.43%) PHP
10 21 (1.36%) T-SQL
11 14 (0.91%) PL/SQL
12 9 (0.58%) Go
12 9 (0.58%) Ruby
13 8 (0.52%) Data Analysis Expressions
13 8 (0.52%) Delphi
13 8 (0.52%) F#
13 8 (0.52%) VB.NET
14 7 (0.45%) Kusto Query Language
14 7 (0.45%) Perl
Qualifications
1 218 (14.14%) Degree
2 69 (4.47%) Azure Certification
3 65 (4.22%) Computer Science Degree
4 56 (3.63%) Security Cleared
5 44 (2.85%) DBS Check
6 39 (2.53%) PMP
7 38 (2.46%) Microsoft Certification
7 38 (2.46%) PMI Certification
8 31 (2.01%) CISSP
9 27 (1.75%) Master's Degree
10 23 (1.49%) Cisco Certification
11 22 (1.43%) AWS Certification
12 19 (1.23%) SC Cleared
13 18 (1.17%) CBAP
14 17 (1.10%) MCSA
14 17 (1.10%) MCSE
15 16 (1.04%) CCNA
16 15 (0.97%) CCNP
17 10 (0.65%) MCP
18 9 (0.58%) ITIL Certification
Quality Assurance & Compliance
1 57 (3.70%) QA
2 45 (2.92%) ISO/IEC 27001
2 45 (2.92%) SLA
3 41 (2.66%) GDPR
4 32 (2.08%) Accessibility
5 29 (1.88%) NIST
6 14 (0.91%) Data Quality
7 12 (0.78%) PMO
8 11 (0.71%) California Consumer Privacy Act
9 10 (0.65%) PCI DSS
10 8 (0.52%) Cyber Essentials
10 8 (0.52%) GRC
10 8 (0.52%) NCSC
10 8 (0.52%) SOC 2
11 7 (0.45%) ISO/IEC 27002 (supersedes ISO/IEC 17799)
12 5 (0.32%) Actionable Recommendations
12 5 (0.32%) NIST 800
13 4 (0.26%) ISO 9001
14 3 (0.19%) HIPAA
14 3 (0.19%) PMBOK
System Software
1 100 (6.49%) Docker
2 59 (3.83%) Active Directory
3 48 (3.11%) VMware Infrastructure
4 21 (1.36%) Virtual Machines
5 19 (1.23%) Virtual Desktop
6 13 (0.84%) VMware ESXi
7 10 (0.65%) Hyper-V
8 8 (0.52%) vSphere
9 3 (0.19%) ProxySG
10 2 (0.13%) HDFS
10 2 (0.13%) KVM
10 2 (0.13%) Xen
Systems Management
1 108 (7.00%) Terraform
2 92 (5.97%) Kubernetes
3 46 (2.98%) Ansible
4 32 (2.08%) Single Sign-On
5 29 (1.88%) Microsoft Intune
6 13 (0.84%) Progress Chef
7 12 (0.78%) Failover Clustering
7 12 (0.78%) Puppet
7 12 (0.78%) SCCM
8 9 (0.58%) Grafana
9 4 (0.26%) Jamf Pro
9 4 (0.26%) SCOM
9 4 (0.26%) WSUS
10 3 (0.19%) Active Directory Federation Services
10 3 (0.19%) Salt
11 2 (0.13%) CASB
11 2 (0.13%) Graylog
11 2 (0.13%) Host Intrusion Detection System
11 2 (0.13%) Prometheus
11 2 (0.13%) SmoothWall
Vendors
1 275 (17.83%) Microsoft
2 81 (5.25%) Google
3 79 (5.12%) Salesforce
4 76 (4.93%) Oracle
5 63 (4.09%) VMware
6 55 (3.57%) ServiceNow
7 40 (2.59%) Cisco
8 32 (2.08%) Databricks
9 28 (1.82%) SAP
10 27 (1.75%) MuleSoft
11 26 (1.69%) YouTube
12 23 (1.49%) HubSpot
13 22 (1.43%) Meraki
13 22 (1.43%) Zoho
14 17 (1.10%) Commvault
15 16 (1.04%) IBM
15 16 (1.04%) Informatica
16 15 (0.97%) Workday
17 13 (0.84%) OpenAI
17 13 (0.84%) Splunk