Customer Relationship Management (CRM)
UK

The table below provides summary statistics for permanent job vacancies requiring CRM skills. It includes a benchmarking guide to the annual salaries offered in vacancies that cited CRM over the 6 months leading up to 30 May 2025, comparing them to the same period in the previous two years.

6 months to
30 May 2025
Same period 2024 Same period 2023
Rank 88 82 115
Rank change year-on-year -6 +33 +49
Permanent jobs citing CRM 1,770 3,246 2,949
As % of all permanent jobs advertised in the UK 3.19% 3.14% 3.04%
As % of the Processes & Methodologies category 3.41% 3.74% 3.18%
Number of salaries quoted 1,065 2,421 1,914
10th Percentile £27,500 £26,250 £35,075
25th Percentile £32,500 £35,219 £43,750
Median annual salary (50th Percentile) £50,000 £51,000 £57,500
Median % change year-on-year -1.96% -11.30% +4.55%
75th Percentile £68,750 £67,500 £76,250
90th Percentile £87,500 £83,750 £92,125
UK excluding London median annual salary £42,500 £47,500 £51,250
% change year-on-year -10.53% -7.32% +2.50%

All Process and Methodology Skills
UK

CRM falls under the Processes and Methodologies category. For comparison with the information above, the following table provides summary statistics for all permanent job vacancies requiring process or methodology skills.

Permanent vacancies with a requirement for process or methodology skills 51,902 86,889 92,846
As % of all permanent jobs advertised in the UK 93.67% 84.13% 95.56%
Number of salaries quoted 25,611 60,763 54,796
10th Percentile £28,822 £29,250 £34,000
25th Percentile £41,250 £40,000 £45,000
Median annual salary (50th Percentile) £57,443 £55,000 £60,899
Median % change year-on-year +4.44% -9.69% +1.50%
75th Percentile £75,000 £72,500 £81,250
90th Percentile £97,500 £92,500 £100,000
UK excluding London median annual salary £51,574 £50,000 £55,000
% change year-on-year +3.15% -9.09% +4.76%

CRM
Job Vacancy Trend

Job postings citing CRM as a proportion of all IT jobs advertised.
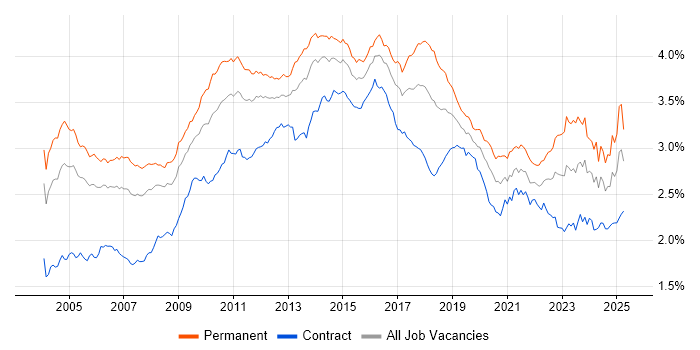
Job vacancy trend for CRM in the UK

CRM
Salary Trend

3-month moving average salary quoted in jobs citing CRM.

Salary trend for CRM in the UK

CRM
Salary Histogram

Salary distribution for jobs citing CRM over the 6 months to 30 May 2025.

Salary histogram for CRM in the UK

CRM
Top 17 Job Locations

The table below looks at the demand and provides a guide to the median salaries quoted in IT jobs citing CRM within the UK over the 6 months to 30 May 2025. The 'Rank Change' column provides an indication of the change in demand within each location based on the same 6 month period last year.

Location Rank Change
on Same Period
Last Year
Matching
Permanent
IT Job Ads
Median Salary
Past 6 Months
Median Salary
% Change
on Same Period
Last Year
Live
Jobs
England -21 1,528 £50,000 -1.96% 11,029
UK excluding London -36 994 £42,500 -10.53% 10,914
Work from Home -15 714 £50,000 -7.91% 5,749
London +9 524 £65,000 +7.30% 1,441
Midlands +10 309 £42,500 +6.09% 2,081
South East -35 266 £45,000 -5.26% 3,102
West Midlands +12 220 £42,500 -5.56% 1,110
North of England -90 211 £38,750 -18.42% 2,465
North West -104 138 £40,000 -15.79% 1,173
East Midlands +8 88 £42,500 +13.33% 843
East of England -47 80 £36,250 -23.68% 1,540
South West -1 64 £51,250 +2.50% 1,215
Yorkshire -22 63 £37,000 -20.43% 1,029
Scotland +34 38 £43,250 -13.50% 441
Wales +40 23 £52,000 -9.57% 272
North East +7 8 £32,050 -44.26% 269
Northern Ireland +41 4 £60,000 -12.73% 153

CRM
Co-occurring Skills and Capabilities by Category

The follow tables expand on the table above by listing co-occurrences grouped by category. The same employment type, locality and period is covered with up to 20 co-occurrences shown in each of the following categories:

Application Platforms
1 103 (5.82%) SharePoint
2 77 (4.35%) Confluence
3 72 (4.07%) CMS
4 20 (1.13%) WordPress
5 19 (1.07%) Microsoft Exchange
6 12 (0.68%) IIS
7 10 (0.56%) IBM Domino
7 10 (0.56%) Tomcat
8 8 (0.45%) Drupal
8 8 (0.45%) Umbraco
9 7 (0.40%) Kentico
9 7 (0.40%) Moodle
10 6 (0.34%) BizTalk Server
11 3 (0.17%) Apache Airflow
12 2 (0.11%) Oracle Workflow
12 2 (0.11%) Sitecore CMS
12 2 (0.11%) SugarCRM
13 1 (0.056%) OpenEdge
13 1 (0.056%) Oracle SOA Suite
13 1 (0.056%) SharePoint Server
Applications
1 233 (13.16%) Microsoft Office
2 114 (6.44%) Microsoft Excel
3 35 (1.98%) Microsoft PowerPoint
4 17 (0.96%) Photoshop
5 16 (0.90%) Maya
6 14 (0.79%) Adobe After Effects
7 13 (0.73%) MS Visio
8 11 (0.62%) Spreadsheet
8 11 (0.62%) Trello
9 10 (0.56%) Microsoft Project
10 9 (0.51%) Adobe Illustrator
11 8 (0.45%) Adobe Premiere
11 8 (0.45%) CapCut
12 6 (0.34%) InDesign
13 5 (0.28%) Adobe Creative Suite
13 5 (0.28%) Chatbot
14 1 (0.056%) SPSS
14 1 (0.056%) SPSS Modeler
Business Applications
1 386 (21.81%) Dynamics CRM
2 153 (8.64%) Salesforce CRM
3 117 (6.61%) NetSuite
4 27 (1.53%) Raiser’s Edge
5 25 (1.41%) Shopify
6 17 (0.96%) Sage 200
7 16 (0.90%) Sage CRM
8 13 (0.73%) Academy Revenues and Benefits
9 11 (0.62%) JDE OneWorld
10 7 (0.40%) Magento
11 5 (0.28%) Adobe Campaign
11 5 (0.28%) CiviCRM
11 5 (0.28%) Dynamics GP
12 4 (0.23%) SAP S/4HANA
12 4 (0.23%) Siebel CRM
13 3 (0.17%) Payment Gateway
13 3 (0.17%) SAP CX
14 2 (0.11%) Elite 3E
14 2 (0.11%) Odoo
14 2 (0.11%) SAP CO
Cloud Services
1 316 (17.85%) Power Platform
2 291 (16.44%) Dynamics 365
3 265 (14.97%) Azure
4 156 (8.81%) SaaS
5 146 (8.25%) PowerApps
6 145 (8.19%) Power Automate
7 135 (7.63%) Microsoft 365
8 80 (4.52%) Miro
9 73 (4.12%) Asana
10 59 (3.33%) Azure DevOps
11 57 (3.22%) Google Analytics
12 55 (3.11%) AWS
13 31 (1.75%) Entra ID
14 28 (1.58%) Canva
15 25 (1.41%) Azure Logic Apps
16 24 (1.36%) Boomi
16 24 (1.36%) Salesforce Service Cloud
17 19 (1.07%) Azure Data Factory
17 19 (1.07%) Cloud Computing
17 19 (1.07%) Serverless
Communications & Networking
1 76 (4.29%) Broadband
2 24 (1.36%) Firewall
3 18 (1.02%) Internet
4 14 (0.79%) Wi-Fi
5 13 (0.73%) WPA
6 12 (0.68%) DNS
6 12 (0.68%) Intranet
6 12 (0.68%) VoIP
7 11 (0.62%) SSL
8 10 (0.56%) VLAN
9 9 (0.51%) DHCP
9 9 (0.51%) DMARC
10 8 (0.45%) LAN
11 7 (0.40%) WAN
12 6 (0.34%) Network Security
12 6 (0.34%) Remote Desktop
13 5 (0.28%) IP Telephony
13 5 (0.28%) Wireless
14 3 (0.17%) 5G
14 3 (0.17%) Unified Communications
Database & Business Intelligence
1 180 (10.17%) Power BI
2 137 (7.74%) SQL Server
3 53 (2.99%) SQL Server Reporting Services
4 42 (2.37%) Tableau
5 37 (2.09%) Data Warehouse
6 35 (1.98%) SQL Server Integration Services
7 19 (1.07%) PostgreSQL
8 17 (0.96%) Data Lake
9 16 (0.90%) Relational Database
10 15 (0.85%) MySQL
11 14 (0.79%) Metadata
12 10 (0.56%) Star Schema
13 8 (0.45%) Oracle Reports
14 5 (0.28%) Electronic Patient Records
14 5 (0.28%) SAP BW
15 4 (0.23%) Data Mining
15 4 (0.23%) DB2
15 4 (0.23%) MaxDB
15 4 (0.23%) SAP HANA
16 3 (0.17%) GIS
Development Applications
1 148 (8.36%) JIRA
2 25 (1.41%) Git
3 14 (0.79%) SQL Server Management Studio (SSMS)
4 8 (0.45%) Jenkins
5 7 (0.40%) Postman
5 7 (0.40%) Selenium
6 5 (0.28%) Grunt
6 5 (0.28%) webpack
7 4 (0.23%) Bazaar
7 4 (0.23%) GitLab
8 3 (0.17%) Visual Studio
9 2 (0.11%) git-flow
9 2 (0.11%) LabVIEW
9 2 (0.11%) Oracle Forms
9 2 (0.11%) SonarQube
9 2 (0.11%) Team Foundation Server
9 2 (0.11%) Visual Studio Code
10 1 (0.056%) Log4Net
10 1 (0.056%) MLflow
10 1 (0.056%) TeamCity
General
1 744 (42.03%) Social Skills
2 540 (30.51%) Finance
3 403 (22.77%) Marketing
4 348 (19.66%) Analytical Skills
5 164 (9.27%) Organisational Skills
6 133 (7.51%) Presentation Skills
7 117 (6.61%) Retail
8 97 (5.48%) Influencing Skills
9 96 (5.42%) Inclusion and Diversity
10 78 (4.41%) Law
11 75 (4.24%) Manufacturing
12 71 (4.01%) Legal
13 58 (3.28%) Public Sector
14 45 (2.54%) Advertising
15 35 (1.98%) Games
16 31 (1.75%) Billing
17 25 (1.41%) Banking
17 25 (1.41%) Pharmaceutical
18 24 (1.36%) Local Government
19 22 (1.24%) Electronics
Job Titles
1 213 (12.03%) Analyst
2 198 (11.19%) Developer
3 172 (9.72%) Senior
4 161 (9.10%) Development Manager
5 146 (8.25%) Business Manager
6 143 (8.08%) Business Development Manager
7 142 (8.02%) Consultant
8 80 (4.52%) Lead
9 79 (4.46%) Support Engineer
10 78 (4.41%) Functional Consultant
11 77 (4.35%) Dynamics 365 Developer
12 75 (4.24%) Applications Support
12 75 (4.24%) IT Support
13 72 (4.07%) Product Analyst
14 71 (4.01%) Architect
15 67 (3.79%) IT Manager
16 63 (3.56%) Technical Support
17 61 (3.45%) Administrator
18 59 (3.33%) Project Manager
19 57 (3.22%) CRM Developer
Libraries, Frameworks & Software Standards
1 118 (6.67%) .NET
2 81 (4.58%) HTML
3 71 (4.01%) CSS
4 47 (2.66%) REST
5 42 (2.37%) JSON
5 42 (2.37%) SOAP
6 39 (2.20%) XML
7 37 (2.09%) .NET Framework
8 27 (1.53%) Web Services
9 26 (1.47%) Lightning Web Components
10 19 (1.07%) ASP.NET Web API
10 19 (1.07%) React
11 18 (1.02%) ASP.NET
12 16 (0.90%) jQuery
13 14 (0.79%) Vue
14 11 (0.62%) CSS3
14 11 (0.62%) Hibernate
15 10 (0.56%) Middleware
15 10 (0.56%) WCF
16 8 (0.45%) EDI
Miscellaneous
1 202 (11.41%) Self-Motivation
2 154 (8.70%) Product Ownership
3 111 (6.27%) Social Media
4 79 (4.46%) Onboarding
5 72 (4.07%) Over-the-Top Content
5 72 (4.07%) Video\Live Streaming
6 67 (3.79%) Management Information System
7 60 (3.39%) Enterprise Software
8 52 (2.94%) Analytical Mindset
9 37 (2.09%) Mobile App
10 32 (1.81%) Driving Licence
10 32 (1.81%) Marketing Technology
11 30 (1.69%) Legacy Systems
12 20 (1.13%) EPoS
13 19 (1.07%) Cloud Native
13 19 (1.07%) Legacy Applications
14 17 (0.96%) Satnav
15 15 (0.85%) Blog
15 15 (0.85%) Taxonomies
16 13 (0.73%) Graphic Design
Operating Systems
1 99 (5.59%) Windows
2 36 (2.03%) Linux
3 25 (1.41%) Android
4 16 (0.90%) Windows Server
5 13 (0.73%) Unix
5 13 (0.73%) Windows Vista
6 9 (0.51%) Windows 10
7 6 (0.34%) Mac OS
8 5 (0.28%) Apple iOS
9 4 (0.23%) AIX
10 2 (0.11%) Windows Server 2019
11 1 (0.056%) Mac OS X
11 1 (0.056%) SUSE
11 1 (0.056%) Windows 7
11 1 (0.056%) Windows Server 2016
Processes & Methodologies
1 532 (30.06%) Problem-Solving
2 381 (21.53%) Agile
3 330 (18.64%) Customer Service
4 273 (15.42%) Project Management
5 260 (14.69%) ERP
6 253 (14.29%) B2B
7 252 (14.24%) Business Development
8 216 (12.20%) Roadmaps
9 215 (12.15%) Stakeholder Management
10 206 (11.64%) Business Intelligence
11 204 (11.53%) Analytics
12 200 (11.30%) Decision-Making
13 179 (10.11%) Migration
14 139 (7.85%) Data Management
15 121 (6.84%) Continuous Improvement
16 113 (6.38%) DevOps
16 113 (6.38%) User Experience
17 110 (6.21%) Mentoring
18 105 (5.93%) Customer-Centricity
18 105 (5.93%) Value Proposition
Programming Languages
1 223 (12.60%) SQL
2 155 (8.76%) JavaScript
3 141 (7.97%) C#
4 47 (2.66%) Python
5 28 (1.58%) PowerShell
6 23 (1.30%) Java
7 19 (1.07%) Apex Code
7 19 (1.07%) PHP
7 19 (1.07%) TypeScript
8 15 (0.85%) VBA
9 12 (0.68%) T-SQL
10 5 (0.28%) R
10 5 (0.28%) Ruby
11 4 (0.23%) ABAP
11 4 (0.23%) Data Analysis Expressions
11 4 (0.23%) PL/SQL
12 3 (0.17%) SOQL
12 3 (0.17%) VB.NET
12 3 (0.17%) X++
13 2 (0.11%) VB
Qualifications
1 255 (14.41%) Degree
2 46 (2.60%) Microsoft Certification
3 45 (2.54%) DBS Check
4 28 (1.58%) Security Cleared
5 18 (1.02%) HND
6 17 (0.96%) HNC
7 16 (0.90%) SC Cleared
8 13 (0.73%) Computer Science Degree
9 10 (0.56%) Master's Degree
9 10 (0.56%) PMI Certification
10 9 (0.51%) TOGAF Certification
11 8 (0.45%) ITIL Certification
12 6 (0.34%) PMP
13 4 (0.23%) Azure Certification
13 4 (0.23%) PRINCE2 Practitioner
14 3 (0.17%) BPSS Clearance
14 3 (0.17%) CISSP
14 3 (0.17%) ITIL Foundation Certificate
14 3 (0.17%) MCSE
14 3 (0.17%) Numerate Degree
Quality Assurance & Compliance
1 100 (5.65%) GDPR
2 93 (5.25%) SLA
3 46 (2.60%) QA
4 45 (2.54%) Data Quality
5 38 (2.15%) Accessibility
6 20 (1.13%) ISO/IEC 27001
7 7 (0.40%) Cyber Essentials
7 7 (0.40%) PCI DSS
8 6 (0.34%) California Consumer Privacy Act
8 6 (0.34%) PMO
9 3 (0.17%) Actionable Recommendations
10 2 (0.11%) PERC
11 1 (0.056%) COBIT
11 1 (0.056%) Disclosure Scotland
11 1 (0.056%) GRC
11 1 (0.056%) HIPAA
11 1 (0.056%) ISO 22301
11 1 (0.056%) ISO/IEC 20000
11 1 (0.056%) NCSC
11 1 (0.056%) PSD2
System Software
1 46 (2.60%) Active Directory
2 18 (1.02%) Docker
3 11 (0.62%) VMware Infrastructure
4 8 (0.45%) Hyper-V
5 5 (0.28%) Virtual Desktop
5 5 (0.28%) VMware ESXi
6 1 (0.056%) BitLocker
6 1 (0.056%) Microsoft App-V
6 1 (0.056%) vSphere
Systems Management
1 23 (1.30%) Microsoft Intune
2 13 (0.73%) Kubernetes
3 12 (0.68%) Single Sign-On
4 8 (0.45%) SCCM
4 8 (0.45%) Terraform
5 6 (0.34%) EMC NetWorker
6 5 (0.28%) vCenter Server
7 3 (0.17%) Ansible
7 3 (0.17%) Systems Management Server (SMS)
8 2 (0.11%) Active Directory Federation Services
8 2 (0.11%) Autotask
9 1 (0.056%) SCOM
Vendors
1 602 (34.01%) Microsoft
2 504 (28.47%) Salesforce
3 132 (7.46%) SAP
4 99 (5.59%) Google
5 56 (3.16%) Oracle
6 51 (2.88%) HubSpot
7 48 (2.71%) Adobe
8 37 (2.09%) Zoho
9 31 (1.75%) Dell
10 26 (1.47%) Facebook
10 26 (1.47%) Sage
11 23 (1.30%) Siebel
12 22 (1.24%) ServiceNow
13 18 (1.02%) Instagram
14 13 (0.73%) MuleSoft
15 12 (0.68%) Databricks
15 12 (0.68%) VMware
16 10 (0.56%) Pardot
17 9 (0.51%) Cisco
17 9 (0.51%) Salesforce Marketing Cloud